The Edge – Guide for Retirement Planning Summary Page
When it comes to retirement planning, focus is everything — and that’s exactly why we’ve separated this module from the lifestyle planning view.
The Retirement Planning Summary Page is designed to help you dive deep into one of the most important client priorities: ensuring a stable, sustainable income for their golden years. 🏖️
🔍 What Can You Do With The Chart?
Here’s a quick rundown:
Input CPF payouts under the Dividend/Annuities Scenarios
Illustrate maturity payouts and see how they align with your client’s retirement goals
Visualize how long funds will last based on income needs and payout flows
Toggle between a chart view or a table view to suit your style — get the big picture or zoom into the numbers

📊 Chart Legend Breakdown
Your chart will include 4 key data tracks — here’s what they mean:
🟦 Balance
This is the remaining retirement fund after deducting the desired retirement income. When this line flatlines, it means the current plan can no longer support the income level — time to adjust the strategy!
🧊 CPF + Dividend
Total income from all CPF Life, annuities, and dividend streams. You can set the start and end age for each payout.
🟥 Desired Retirement Income
This is the amount your client wants to draw yearly in retirement. It adjusts for inflation, so you’ll see it rise over time to reflect real-world cost increases.
🟩 Maturity Payout
These are the lump-sum amounts scheduled to come in at specific ages — perfect for illustrating how endowment plans or other maturity events fill income gaps.
This page is your retirement storytelling canvas — use it to highlight sustainability, risks, and opportunities in a way clients can truly understand.
📋 Retirement Summary Table: Seeing the Full Picture
Beyond the charts, the Retirement Summary Table gives your clients a clear snapshot of what it really takes to retire comfortably.
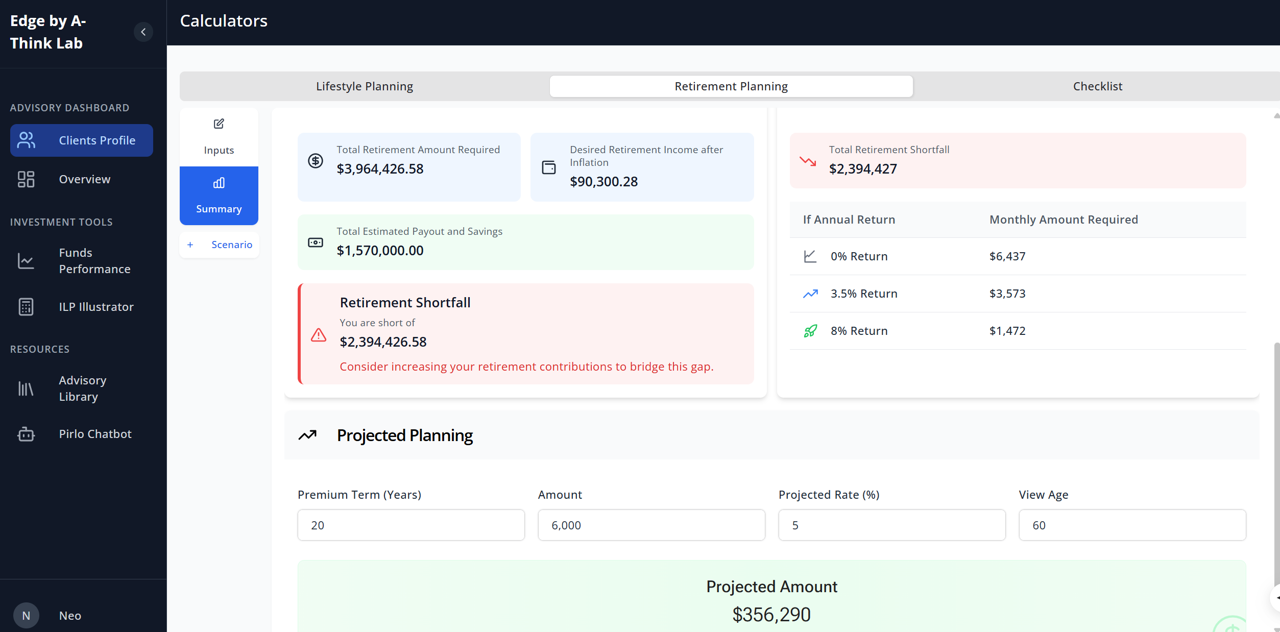
Here’s what it includes:
🔹 Total Retirement Amount Needed
This shows how much the client needs by their desired retirement age to support themselves up to age 89 (We’ve added a few extra years to life expectancy to reflect the trend of longer lifespans.)
🔹 Inflation-Adjusted Income
The table reflects the real cost of retirement by showing how inflation affects their desired income. This helps set realistic expectations and frames the urgency to plan well.
🔹 Remaining Gap to Goal
All current resources and projected payouts are added up, and what’s left is the shortfall — a simple, powerful number that shows what’s still needed.
🧮 Retirement Breakdown Table
Right next to the summary, you’ll find a breakdown table showing:
How much needs to be set aside monthly
Based on 3 different rates of return
From now until retirement age
🧠 Projected Planning Calculator: Fast Forecasts, Smarter Conversations
To make your planning conversations even smoother, we’ve included a Projected Planning Calculator right on the Retirement Summary page.
Here’s what it does:
Helps estimate the potential amount accumulated by retirement age
Based on the monthly commitment and the assumed rate of return discussed
No need to pause the flow by generating formal quotations
This gives a flexible ballpark estimate that helps you build a practical, achievable action plan with your client — no guesswork, just numbers that make sense, perfect for sparking productive discussions before diving into the finer details.
All together, this tool helps advisors shift the retirement convo from vague dreams to grounded, data-backed strategies — while still keeping it client-friendly and visual.